FUNGIpath predicts orthologous groups of protein with the MaRiO pipeline and allows an easy exploration of the metabolism afforded by fungal species represented in the associated database ( Release 4.0).
The MaRiO pipeline is described in the article: Pereira C, Denise A, Lespinet O (2014). A meta-approach for improving the prediction and the functional annotation of ortholog groups. BMC Genomics 2014;15:S16.
You can find additional informations in the publication: FUNGIpath: a tool to assess fungal metabolic pathways predicted by orthology. Grossetete S, Labedan B, Lespinet O. BMC Genomics 2010;11:81.
Index
- Explore pathways
- Search for orthologs
- Data
- Explore pathways
- "Explore pathways" queries
- Analyse of a publicly available pathway [form 1]
- Search a KEGG or Metacyc pathway from keywords [form 2] or EC number(s) [form 3] :
- Enter a personal pathway to analyse [form 4]
- "Explore pathways" result pages
- Colorized pathway
- Summary table
- Species table
- Search through ortholog groups
- "Search for orthologs" queries page
- Display ortholog groups with a specified species profile
- Search ortholog groups with keywords
- Search an ortholog group containing a protein of interest
- Search an ortholog group with a protein sequence
- "Search for orthologs" result pages
- Data
- Genome data
- Enzymatic data
- Programs for ortholog prediction
- Best Reciprocal Hits
- Inparanoid [6]
- OrthoMCL [7]
- Phylogeny [8]
- Download data
- Release:
- Release 4.0: Ortholog groups built with MARIO, May 2014, 165 genomes (MetaCyc Release 17.5 / KEGG version 73.0 / Swiss-Prot Release 2015_09)
- Release 3.0: Ortholog groups built with FUNGIpath: June 2010, 50 genomes (MetaCyc Release 14.0 / KEGG version 2010-25-02 / Swiss-Prot Release 2010_04)
- Release 2.0: Ortholog groups built with FUNGIpath: April 2010, 31 genomes (MetaCyc Release 13.6 / KEGG version 2010-25-02 / Swiss-Prot Release 57.14)
- Release 1.0: Ortholog groups built with FUNGIpath: February 2009, 20 genomes (MetaCyc Release 12.5 / KEGG version 2009-02-02 / Swiss-Prot Release 56.7)
- References
To explore metabolic pathways in fungi, you may first select fungi genomes to include in the search. The default option (no prior user choice was done in the "Species selection" section) is: all genomes are "selected". Then, there is two possibilities to choose a pathway to analyse:
You can choose a pathway from 2 external databases, KEGG [1] or MetaCyc [2]. For each step of the selected pathway for which the reaction is characterized by a complete EC number (4 class numbers), the program check if the corresponding enzymatic activity is present in the genome of each "selected" species (i. e. if protein(s) annotated with that EC number are found in some orthologs groups of our database). The conservation rate among the "selected" species is represented by a color code.
You can search a KEGG or Metacyc pathways whose definition match with keywords or harboring EC numbers whose definition match with keywords. You can also select a KEGG and Metacyc pathway harboring a list of EC numbers.
You can upload your personal pathway in Metacyc-like BIOPAX2 format (Biopathway Exchange Language). BIOPAX formats permit to exchange biological pathway data (More infos on the BIOPAX ontology). We don't use all ontology classes. You will find a simple biopax model below.
|
|
The BIOPAX2 file must contains hierachical classes:
- A pathway description:
Foreach reactions, you must indicate left and right product(s) thanks to an ID compound (the compound description itself correspond to the physicalEntityParticipant tag), eventual EC numbers and reaction directions. If no EC number is available the name of the reaction will appear in the pathway picture.
- substrats and products for each reaction:In the pathway representation, the color of the EC number boxes show the conservation rate between the "selected" species (default between all FUNGIpath species).
Example of the Aflatoxin biosynthesis pathway from KEGG [1] matching with all FUNGIpath species with our color code 
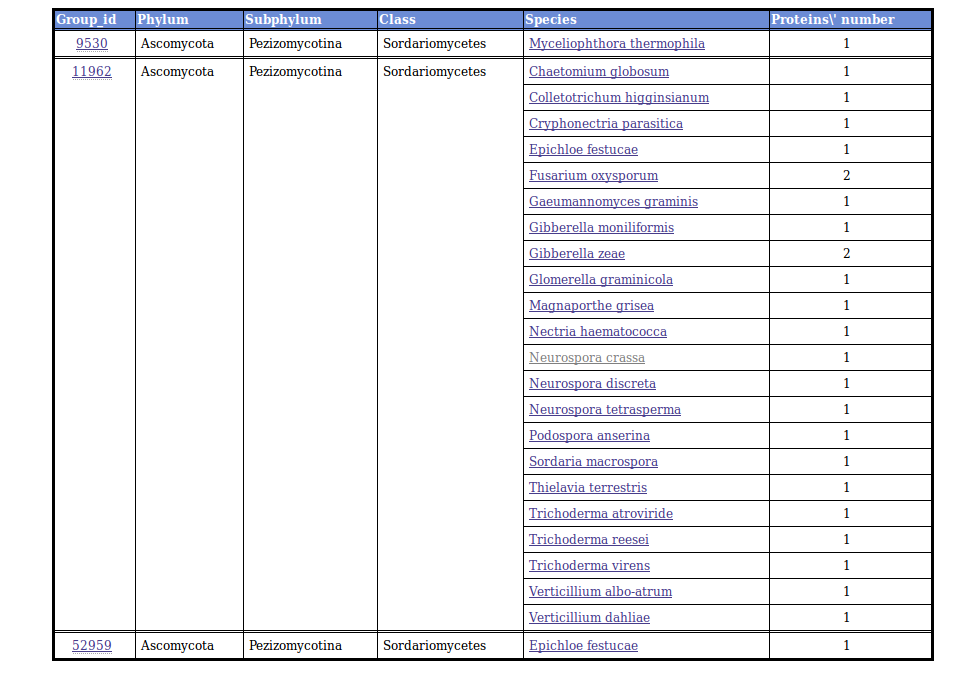
Each colorized box is linked to a table displaying a list of orthologous proteins annotated with the corresponding EC number in the "selected" species. The table present a taxonomic classification of the "selected" species (here the Sordariomycetes class) and the numbers of proteins with the chosen enymatic activity in each species.
The table contains multiple links to access to the proteins sequences of the different species along with a link to a similar table displaying the whole group content (all FUNGIpath species). This latter page contains the Gene Ontololy annotations of FUNGIpath for the group
Finaly, under the "EC number" linked table, a list of pathways harboring the same enzymatic activity/EC number is available at the end of the page and the corresponding links should be used to submit a new query.
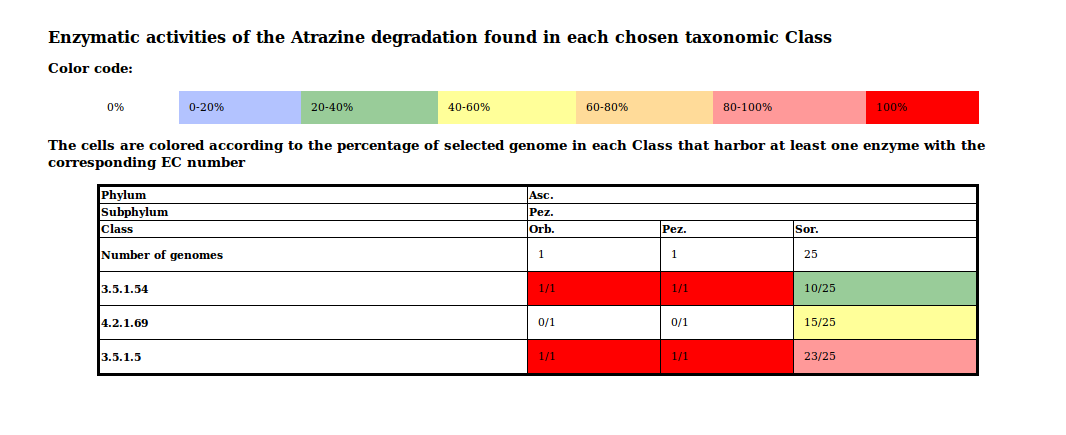
The summary table is an overview of the results grouped by Class and EC numbers. A color code represents the conservations inside each taxonomic group.
 Example of summary table
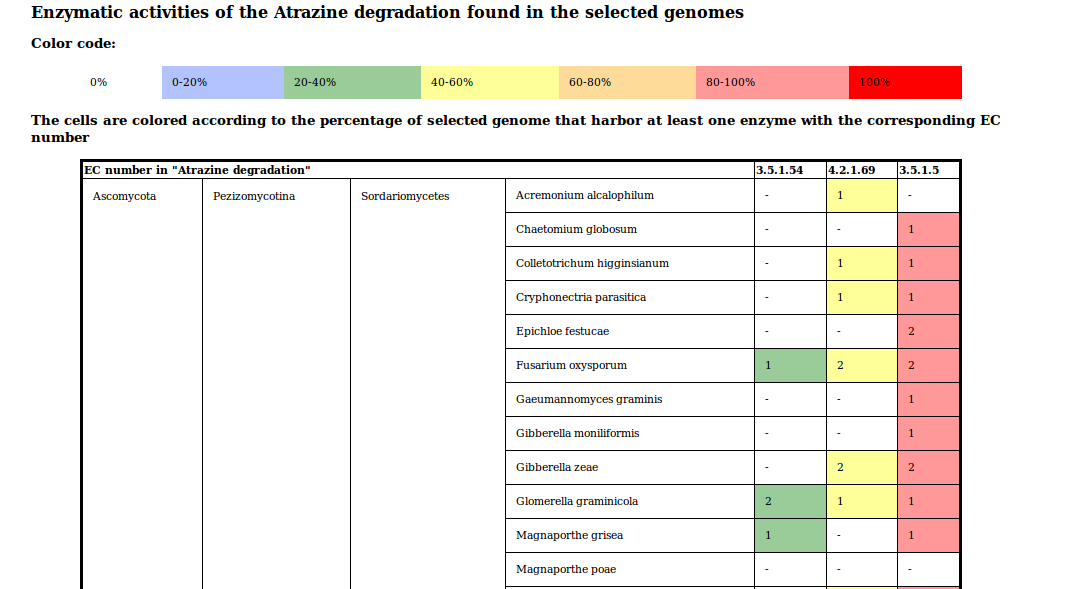
The species table is a table which gives details foreach genome and each EC number. Foreach genome, you have the number of genes annotated with the EC numbers of the pathway that are at least found in one of the "selected" genomes.
 Example of species table
Select your genomes in the "species selection" tab of the top menu. In the selection form, a genome can be "selected", "allowed" or "excluded". if the option "One protein from at least one of the "selected" species is chosen, the "selected" genome must be represented by at least one protein in the displayed orthologous group. Else, the displayed groups must contain a protein from each "selected" species. The "allowed" species can be represented or not. Finally the "excluded" species must not be represented.
You can use keywords to identify orthologs groups. Keywords could be EC numbers (1.1.1.1), Gene Ontology entries (GO:0071051) or strings. Strings will be searched in the function of the group or in its EC numbers definition, if any. On Submit you will access to a checkbox to validate the groups to display. At this stage you can choose to display the data according to your eventual prior choice in the "Species selection" section or the full FUNGIpath group.
You can limit the search by specifying a protein ID or name. If you know the FUNGIpath ID of your sequence, you can use the browser available on the home page. Otherwise, ....
You can use a protein sequence to identify an ortholog group. You can paste or upload a fasta formatted sequence and a HMM search will find the most similar group of sequence and display it if this e-value is smaller than the cut off.
For the first choice "Search the full list of orthologous groups of proteins corresponding to a taxonomic profile", often leading to a big number of groups, the results are first summerized in tables displaying the content of 10 orthologs groups grouped by Class. Each line represents an orthologous group. According to the number of "selected" and "excluded" species, there will be thousands of pages.The first column is the FUNGIpath group ID. The second column is the FUNGIpath inferred function. The thirth column display the EC numbers we assign to the group. The Fourth column is the number of proteins from the "selected" and "allowed" species found in the group. The second number in brackets is the number of species represented in the group. The other columns are the same data restricted to each taxonomic Class. If you move the mouse over cells, you can display species name and protein IDs in infobulles.

Example of summary table
Results, identified by a search ID, are downloadable as a text file.
There is two possibilities to filter the results: using a keyword selection that will be applied on functions and enzymatic activities (EC number definitions) or restricting the results to those groups where a chosen percentage of the "selected" strains are represented.
If you click on a group ID, you will get a new window displaying the group data. Groups are identified by an unique ID and are eventualy annotated with an inferred function or/and enzymatic activities and/or GO entries (Gene Ontology ID). The function is assigned by comparison of the HMM profile of the group and the sequences annotated in SwissProt. The function of the sequence presenting the smaller e-value of comparison is transferred to the group if this e-value is smaller than the cut off. The EC number list is predicted by comparison between the HMM profil [3] of the ortholog group and the sequences of SwissProt [4] and MetaCyc [2] presenting EC number annotations. The EC numbers associed to the results with the smaller e-value are used if the e-value is smaller than the cut off. The page is linked to alignment and tree of the group sequences. The table display the full taxonomy and for each "selected" and "allowed" species, the numbers of gene found in the group. Species name are links to the sequences (fasta formatted). You can choose to display only the data from the "selected" species
The public data used in this database are indicated in the table below. Identical protein sequences or identical ID in the same genome have been deleted prior to our analysis.
* NCBI taxonomy
The sequences with ID 'NewProt*' are proteins which are absent (or incomplete) in the downloaded file (proteins) but which have been detected with a TBLASTN against the contigs.
For EC number annotation, currently we used 2 references: Swiss-Prot database [3] and MetaCyc [2]. We transfered EC number from reference to other genomes thanks to ortholog prediction and HMM search [4]
To determine orthologous groups, we used 4 different methods. Currently, we merge groups obtained by the different methods with the MARIO pipeline
The methods used to build orthologous clusters are :
We implemented perl scripts to perform BRH cluster. The script made BLASTP [5] (version 2.2.15 downloaded on the NCBI page) all against all. Then, from the BRH pair, we built groups by multiple linkage. We use threshold on score ratio (0.2) and percent alignment (60%).
We used Inparanoid [6] between each genome pair. Then we built groups from inparanoid cluster by single linkage.
From BLASTP results, we run the OrthoMCL [7] program to get orthologous groups. This method build a graph and use Markov Cluster Algorithm to delete linkage between father proteins and strengthen close proteins.
From BLASTP results, we built protein family (we clustered together proteins which are found with an E-value < 10-3 and an aligned percent > 70%). For the bigger families (more than 250 proteins), we use Markov CLuster algorithm [9] to reduce the size of the family. Then, foreach family, a multiple alignment was realised by the Muscle [10] program (version 3.6) and a tree was constructed by PhyML [11]. We used Phylip [12] package to root trees and to convert them from phylip format to nexus format (Retree program) and the program TreeGraph [13] for tree visualisation.
[1] KEGG: Kyoto Encyclopedia of Genes and Genomes. - Ogata H, Goto S, Sato K, Fujibuchi W, Bono H, Kanehisa M. - Nucleic Acids Res 1999, 27:29-34. [2] The MetaCyc Database of metabolic pathways and enzymes and the BioCyc collection of Pathway/Genome Databases. - Caspi R, Foerster H, Fulcher CA, Kaipa P, Krummenacker M, Latendresse M, Paley S, Rhee SY, Shearer AG, Tissier C, Walk TC, Zhang P, Karp PD - Nucleic Acids Res 2008, 36:623-31 [3] Profile Hidden Markov models. - Eddy SR - Bioinformatics 1998, 14(9):755-63. [4] The universal protein resource (UniProt). - The UniProt Consortium - Nucleic Acids Res 2008, 36:D190-195. [5] Basic local alignment search tool. - Altschul SF, Gish W, Miller W, Myers EW, Lipman DJ. - J Mol Biol. 1990 Oct 5;215(3):403-10. [6] Automatic clustering of orthologs and in-paralogs from pairwise species comparisons. - Remm M, Storm CE, Sonnhammer EL. - J Mol Biol. 2001 Dec 14;314(5):1041-52. [7] OrthoMCL: identification of orthologous groups for eukaryotic genomes. - Li L, Stoeckert CJ Jr, Roos DS. - Genome Res. 2003 Sep;13(9):2178-89. [8] Assessing the evolutionary rate of positional orthologous genes in prokaryotes using synteny data. - Lemoine F, Lespinet O, Labedan B - BMC Evol Biol 2007, 7:237. [9] An efficient algorithm for large-scale detection of protein families. - Enright AJ, Van Dongen S, Ouzounis CA. - Nucleic Acids Res. 2002 Apr 1;30(7):1575-84. [10] MUSCLE: multiple sequence alignment with high accuracy and high throughput. - Edgar RC. - Nucleic Acids Res. 2004 Mar 19;32(5):1792-7. Print 2004. [11] A simple, fast, and accurate algorithm to estimate large phylogenies by maximum likelihood. - Guindon S, Gascuel O. - Syst Biol. 2003 Oct;52(5):696-704. [12] PHYLIP (Phylogeny Inference Package) version 3.6. - Felsenstein, J. 2005. - Distributed by the author. Department of Genome Sciences, University of Washington, Seattle. [13] TreeGraph: automated drawing of complex tree figures using an extensible tree description format - Müller J, Müller K - 2004, Molecular Ecology Notes,4, 786-788.


